The good data use is an almost obligatory requirement for any Product team, but even more so in a Product-led environment. In this world, Product is at the centre of everything that happens in the company and also drives its success. Sales is not a separate department that asks the Product team for new features, for example, but orbits around the goals and milestones that are set on a quarterly or annual basis.
A product-led approach means investing in market and user research, product development and analysis to stay ahead of the competitors and adjust to changes in the industry or market. The challenge is to maintain growth by monetising user value with an effective scalability strategy. An example of this type of company is Netflix, which has based almost all of its success on its technological product over its content catalogue.
With the Product at the centre of the company, roles such as the Product Manager take on greater strategic importance, so the KPIs that must be utilised to ensure the viability of the project go beyond the Product itself.
These metrics address different aspects of a company and its product:
- Business outcomes
- Product usage
- Product quality
This list does not include all the metrics that exist in this field, nor can they all be used in the same way. There are enough casuistries around the KPIs that it is impossible to recommend a closed list: whether it has a B2B or B2C business model, whether the company is in a growth or scale-up phase, the type of sector in which it operates, etc.
Product-led metrics and how to calculate them
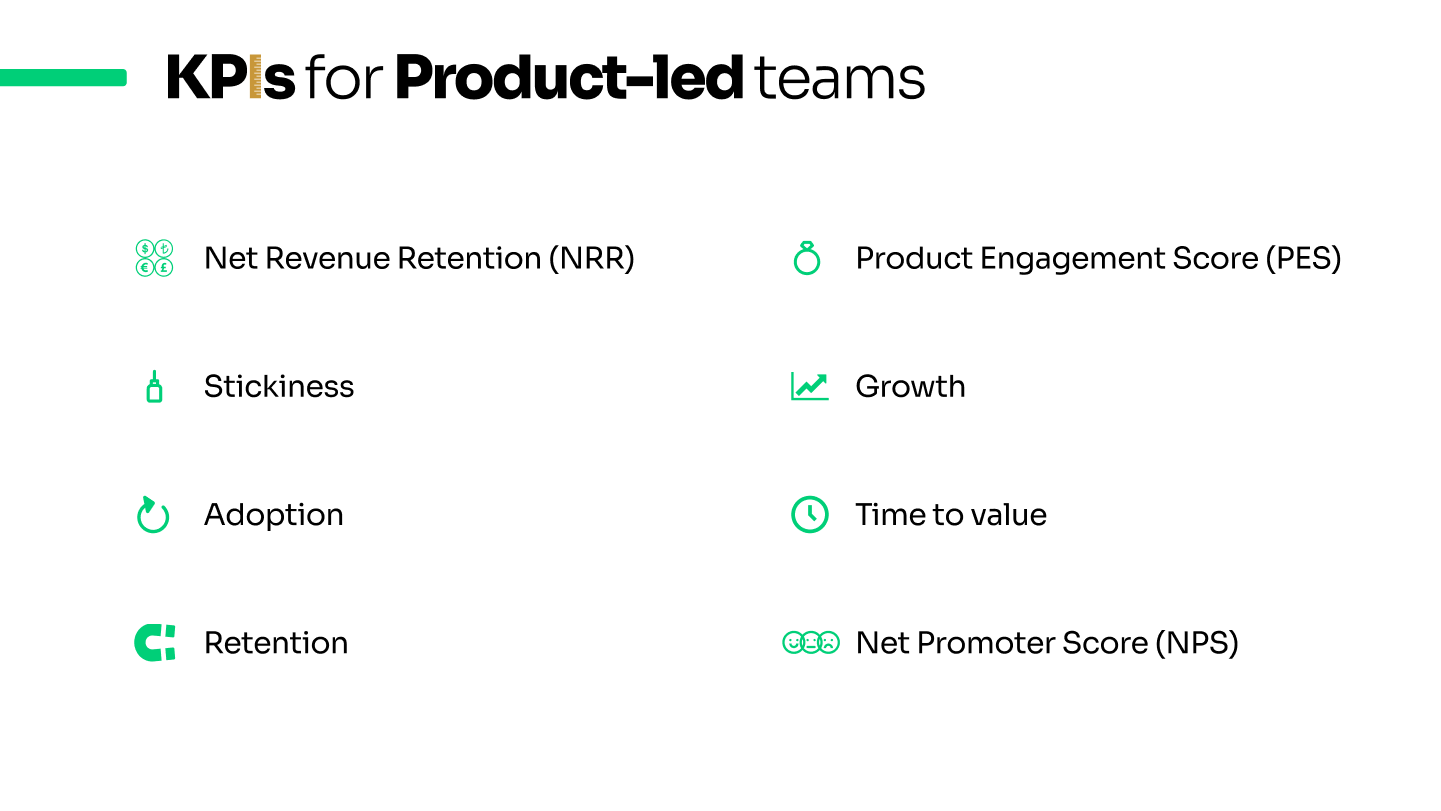
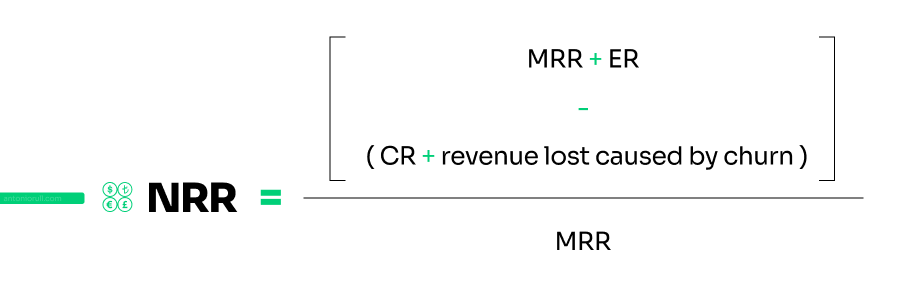
Net Revenue Retention (NRR)
Not to be confused with MRR (Monthly Recurring Revenue) or ARR (Annual Recurring Revenue). This metric differs from recurring revenue metrics because it is retrospective and reflects the recurring revenue retained over a specific period of time.
It measures how good a company is at renewing or maintaining its existing customer base, as well as how good it is at generating additional revenue from those same customers.
For example, if in January you have 100 customers who paid £1,000 each and, over time, you lose one customer (CR: Contraction Revenue) and two double the size of their contract (ER: Expansion Revenue), the ARR of £100,000 at the beginning of the year is now £101,000 at the end of the year, which means that the NRR is 101%.
How to measure NRR
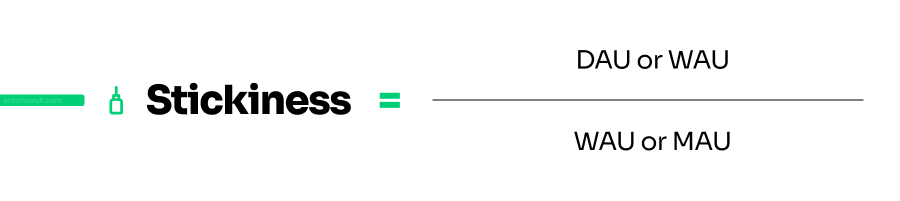
Stickiness
Measure the number of users who have a high level of engagement with your product. These are the ones who come back to use the product again and again. It is one of the Product-Market Fit signals and is widely used both to identify the value of a product and to raise funding rounds in the case of startups by showing a clear indicator of traction.
It takes into account the number of daily (DAU), weekly (WAU) and monthly (MAU) active users.
For example, if Spotify has 300 monthly active users and 30 of them access the product every day, the stickiness of the product is 10%.
Stickiness can be measured not only at the product level, but also at the functionality level. Thus, we can identify which is used the most and which the least. Breaking down to this point can be helpful, especially for B2B companies where infrequent use does not mean that there are problems per se.
How to measure stickiness
Depending on the case of each product, the DAU or WAU, or even YAU in some cases, e.g. in the case of a banking application that is not consulted every day, should be taken into account.
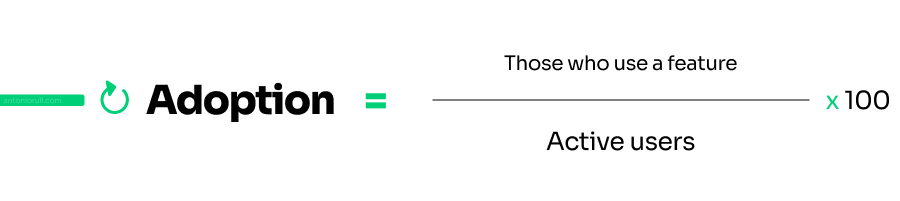
Adoption
This metric can also be applied at product level and at functionality level.
In the case of the product, the same metrics are used as for stickiness (DAU, MAU, WAU…), but in this case it uses absolute numbers comparing time periods.
Adoption is very handy when new features are launched or significant changes are made. In this case, it is a percentage and shows the number of users who have tried some type of new element compared to the total number of active users in that period of time.
How to measure adoption
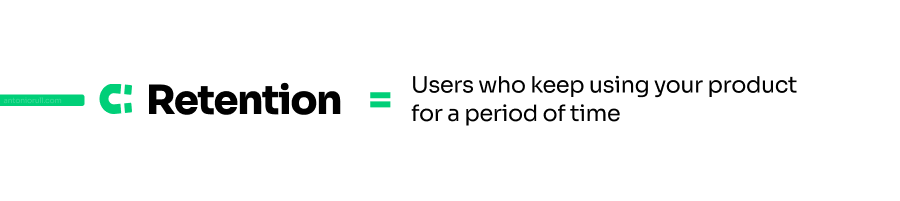
Retention
This is also typically known, especially in analytical tools, as cohorts.
It is useful for growth as well. It considers first-time users in a given time period (usually a month or a week) and calculates the percentage of those users who come back in subsequent time periods.
How to measure retention
There is no dedicated mathematical formula. In this case it is preferable to use an analytics tool that does the calculation, e.g. Amplitude.
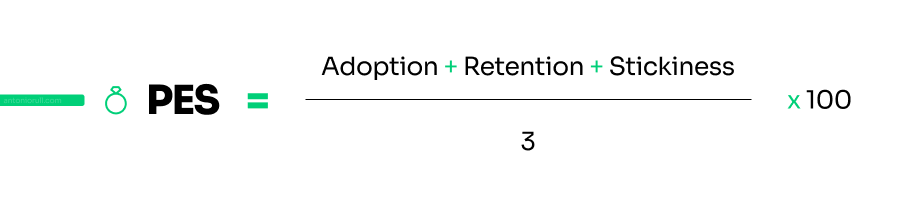
Product Engagement Score (PES)
It is a high-level metric that measures the quality of your product in terms of usage, growth and adoption, so it takes into account the three metrics above. It doesn’t just give you a number, but allows you to investigate why it changes month on month, while defining the next steps to take to improve it.
How to measure Product Engagement Score
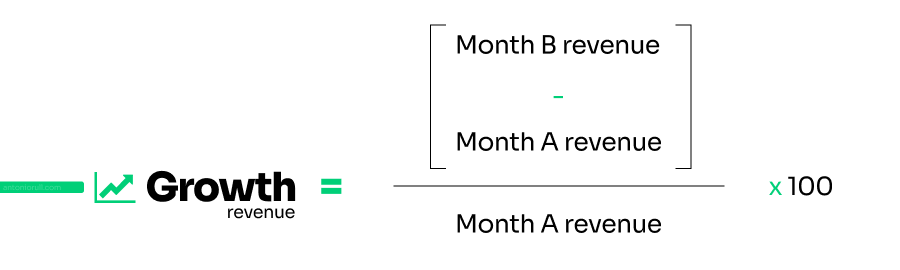
Growth
Indicates the pace at which your user base or revenue grows month over month. The formula can be replicated using users, revenue, etc.
How to measure user growth

How to measure revenue growth
Time to value
Closely related to user onboarding and First User Experience (FUX), as well as sales. This metric helps to identify the time period or the actions and steps that a user has to take to comprehend and assimilate the value offered by a product. In essence, the lower the value, the better.
In terms of competition, a product can find success if it reduces time to value significantly more than its competitors.
Some initiatives that can be taken to reduce this value focus on customer support, onboarding guides for new users or the usability of the product itself.
How to measure time to value
Like retention, there is no such thing as a single formula, but depends on the type of product, the sector and the business model, among other factors.

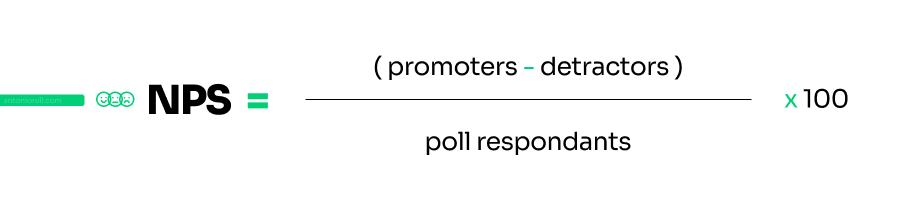
Net Promoter Score
Much more commonly used than the PES to understand the perceived health of a product. In this case, it is a number that summarises the intention of users to recommend your product. It is based on the premise that those who recommend a product find a high value in it and want other people to use it as well.
It is obtained from a survey of all users containing only one question:
How likely would you be to recommend this product to a friend or colleague?
The question can only be answered on a scale from 0 to 10, with three cohorts of users organised on the results of their answers:
- 0 to 6: detractors
- 7 to 8: passive
- 9 to 10: promoters
The result ranges from -100 to 100. Anything above zero is considered a good result, and if you have more than 50 NPS you are in for an excellent result.
How to measure NPS